Playground

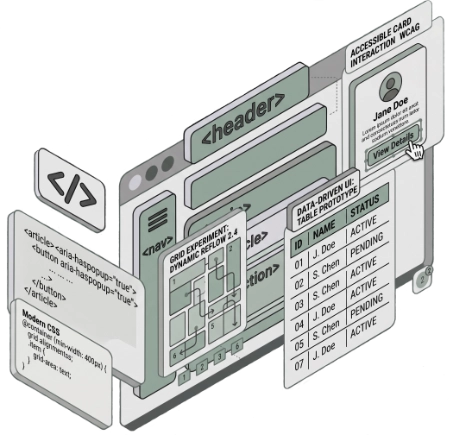
This playground is where I test ideas for front-of-site work: layout patterns, interaction prototypes, and data-driven interfaces. Everything starts with semantic HTML and modern CSS, with accessibility and readable content as the baseline rather than an afterthought.

Some projects are quick proofs-of-concept, others are more developed patterns built around real content. Together they show how I think about structure, motion, and performance: start with a clean document, layer in behaviour gradually, and keep things working across devices, browsers, and assistive tech.

If you are here as a hiring manager or collaborator, treat this space as the lab behind the portfolio. It is where I refactor older work, explore new techniques, and grow reusable building blocks that can feed into design systems, marketing sites, and production codebases.

To view some of the new techniques I am exploring, check out my CSS Evangelist Architecture Portal: a collection of experiments built with the latest features and methodologies to create resilient, future-proof interfaces.

Explore the project collections

These three collections group related experiments so you can dive straight into the kind of work you care about most—whether that’s layout foundations, interactive UI prototypes, or data visualisations and charts.

Layouts

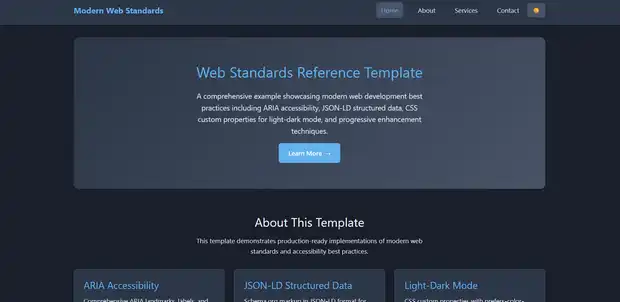
Example responsive  website layout with web standards

Layout projects explore page structure for small, content-heavy sites: landing pages, multi-column articles, breakpoint studies, and responsive grids. The focus is on hierarchy, typography, and flow—keeping copy readable from mobile to widescreen while I test navigation, card layouts, and component patterns that scale into full design systems.

Prototypes
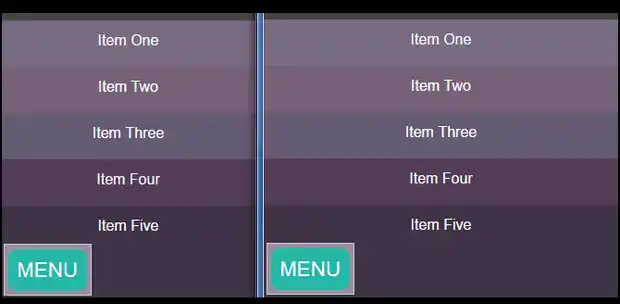
Clickup Navigation

Prototype projects concentrate on behaviour: mobile navigation, galleries, accordions, micro-interactions, and other UI patterns. These focused experiments are built with vanilla HTML, CSS, and a little JavaScript to refine timing, motion, and affordances before the patterns appear in production sites, emails, or design-system documentation.

Data Charts
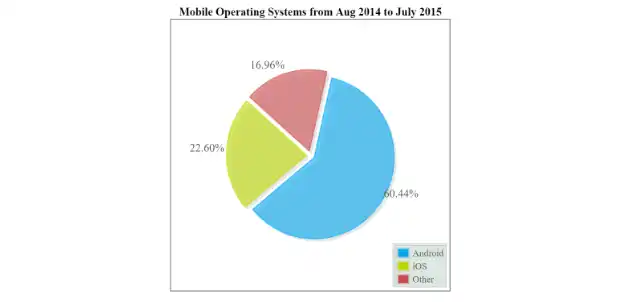
HTML5 pie chart showing Mobile Operating Systems usage from August 2014 to July 2015

Data projects turn numbers into stories, from HTML5 charts to interactive D3 diagrams and node trees. I experiment with how to label, colour, and animate information so it stays accessible and performant, giving people clear comparisons and relationships without overwhelming them—whether they are on a phone, laptop, or assistive technology.